School of Business Accreditation
The Lincoln University School of Business is proud to undergo a rigorous reaffirmation of accreditation by the Accreditation Council for Business Schools and Programs (ACBSP) every ten years. This process, conducted by one of the leading specialized accreditation bodies for business programs, ensures that our School of Business meets high standards in educational quality and continuous improvement. Please explore the Lincoln University School of Business program student outcome data below, highlighting our commitment to excellence and student success.
Accounting Student Outcome Data
| Semester | Full-Time Students | Part-Time Students | Total Students |
|---|---|---|---|
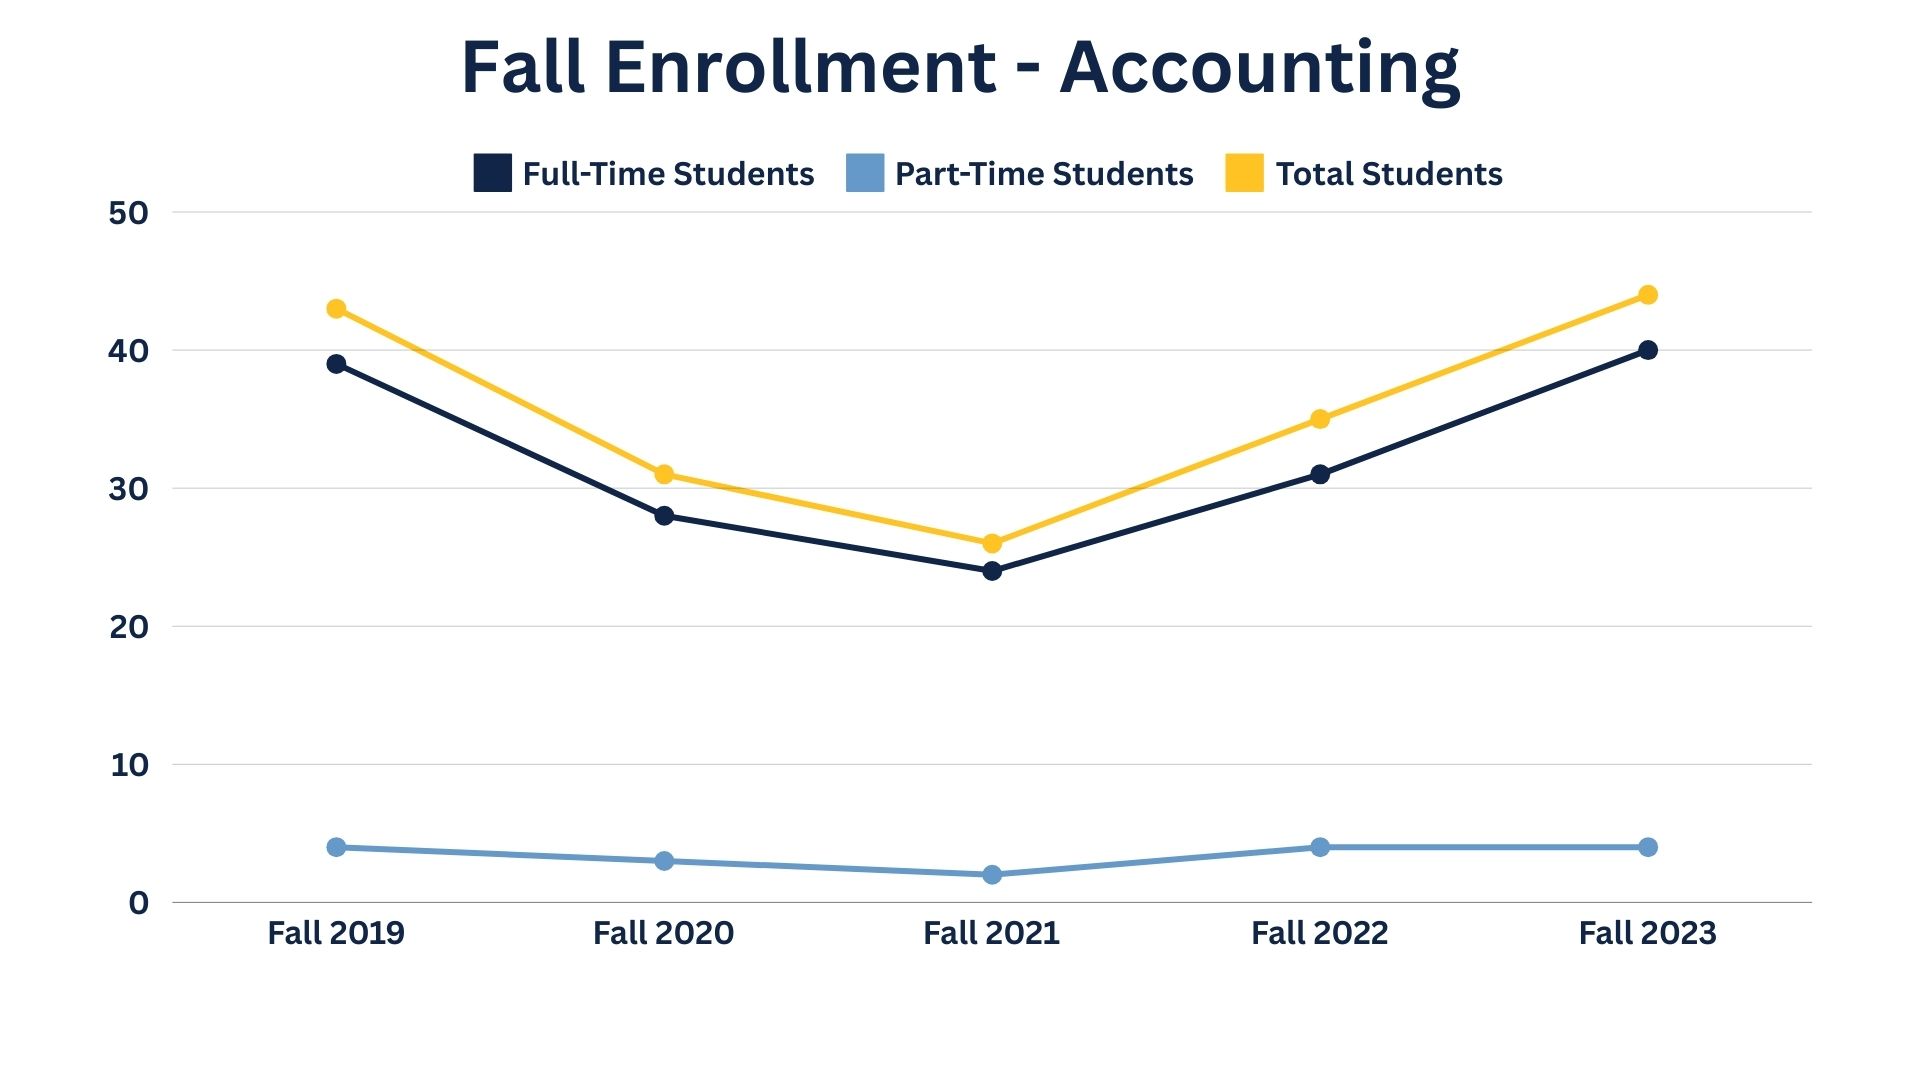
| Fall 2019 | 39 | 4 | 43 |
| Fall 2020 | 28 | 3 | 31 |
| Fall 2021 | 24 | 2 | 26 |
| Fall 2022 | 31 | 4 | 35 |
| Fall 2023 | 40 | 4 | 44 |
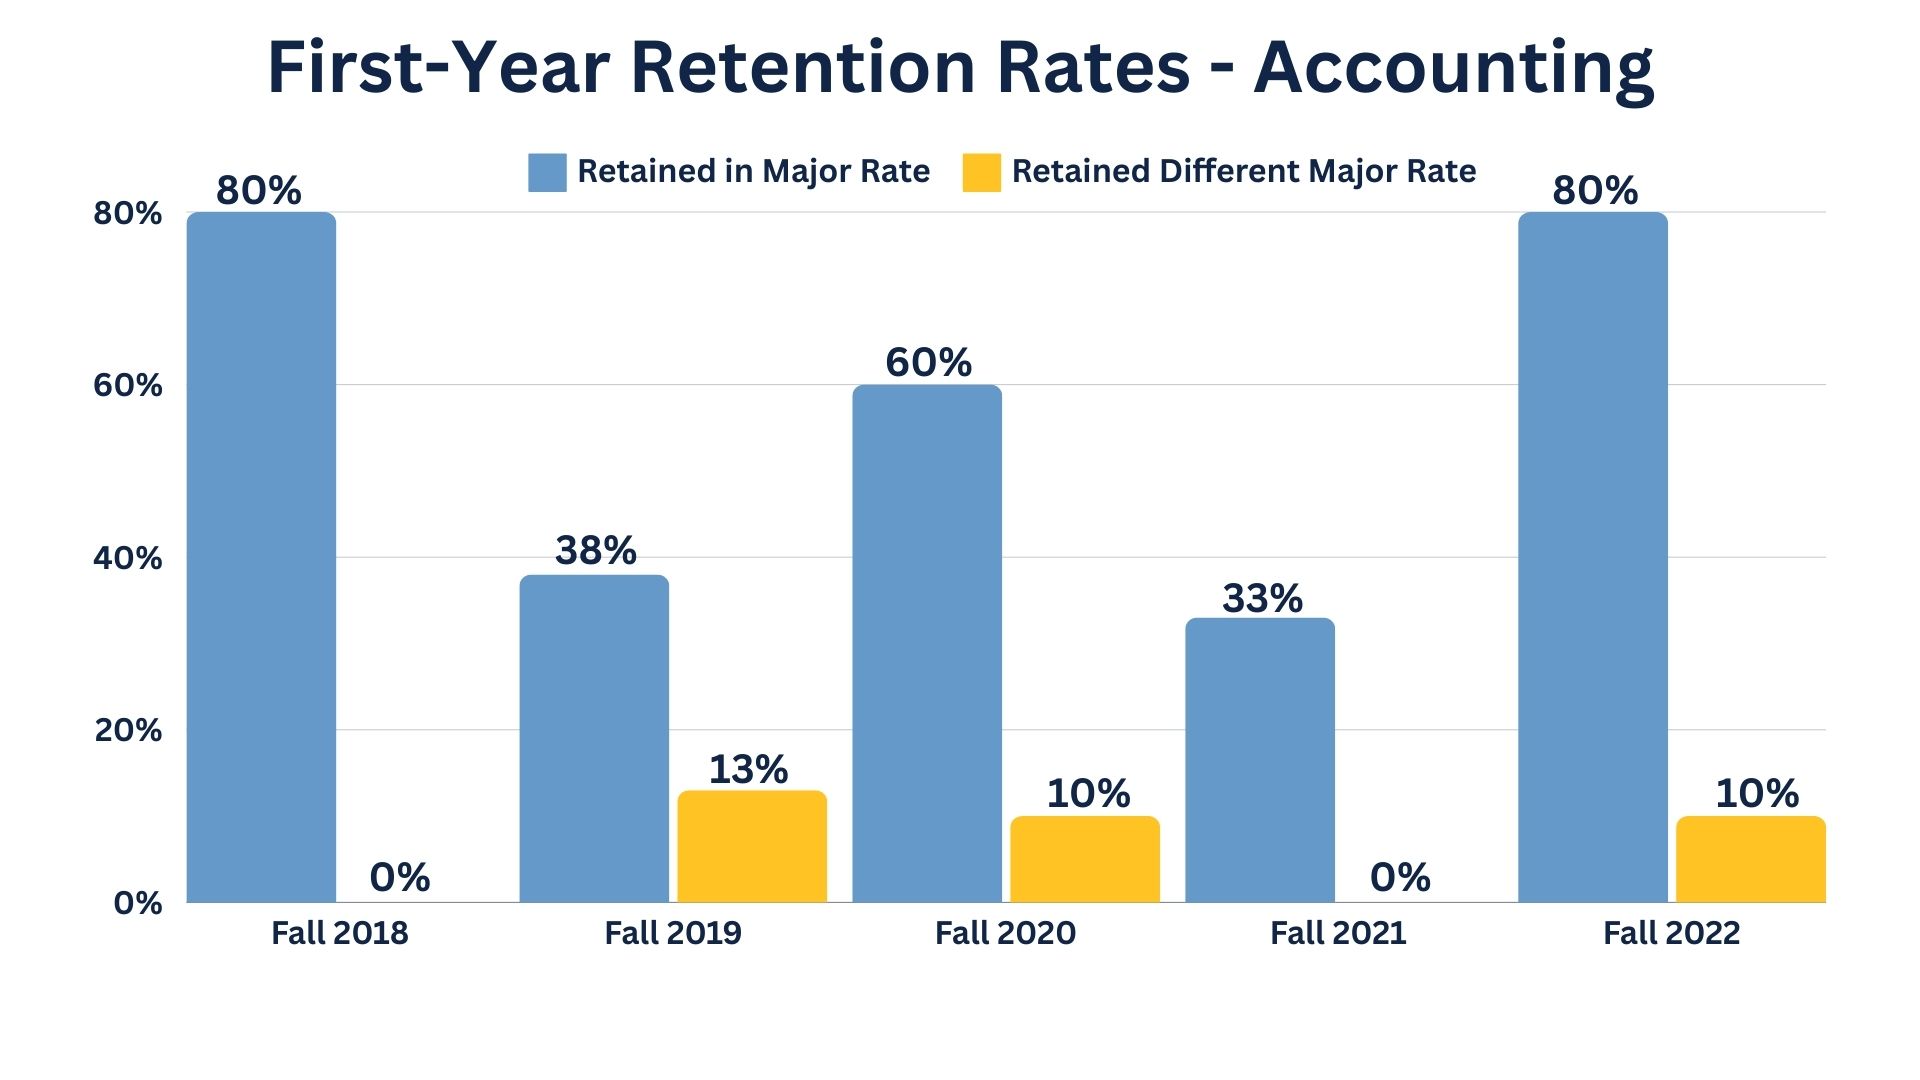
| Cohort | Number in Cohort | Retained in Major | Retained in Major Rate | Retained in Different Major | Different Major Rate |
|---|---|---|---|---|---|
| Fall 2018 | 10 | 8 | 80% | 0 | 0% |
| Fall 2019 | 8 | 3 | 38% | 1 | 13% |
| Fall 2020 | 10 | 6 | 60% | 1 | 10% |
| Fall 2021 | 3 | 1 | 33% | 0 | 0% |
| Fall 2022 | 10 | 8 | 80% | 1 | 10% |
| Cohort | Number in Cohort | Grad in 4 Years | Graduation Rate | Grad in 5 Years | Graduation Rate | Grad in 6 Years | Graduation Rate | Attrition Rate |
|---|---|---|---|---|---|---|---|---|
| Fall 2013 | 6 | 0 | 0% | 1 | 17% | 3 | 50% | 50% |
| Fall 2014 | 8 | 1 | 13% | 3 | 38% | 3 | 38% | 63% |
| Fall 2015 | 8 | 4 | 50% | 4 | 50% | 4 | 50% | 50% |
| Fall 2016 | 8 | 0 | 0% | 0 | 0% | 0 | 0% | 0% |
| Fall 2017 | 7 | 1 | 14% | 1 | 14% | 2 | 29% | 71% |
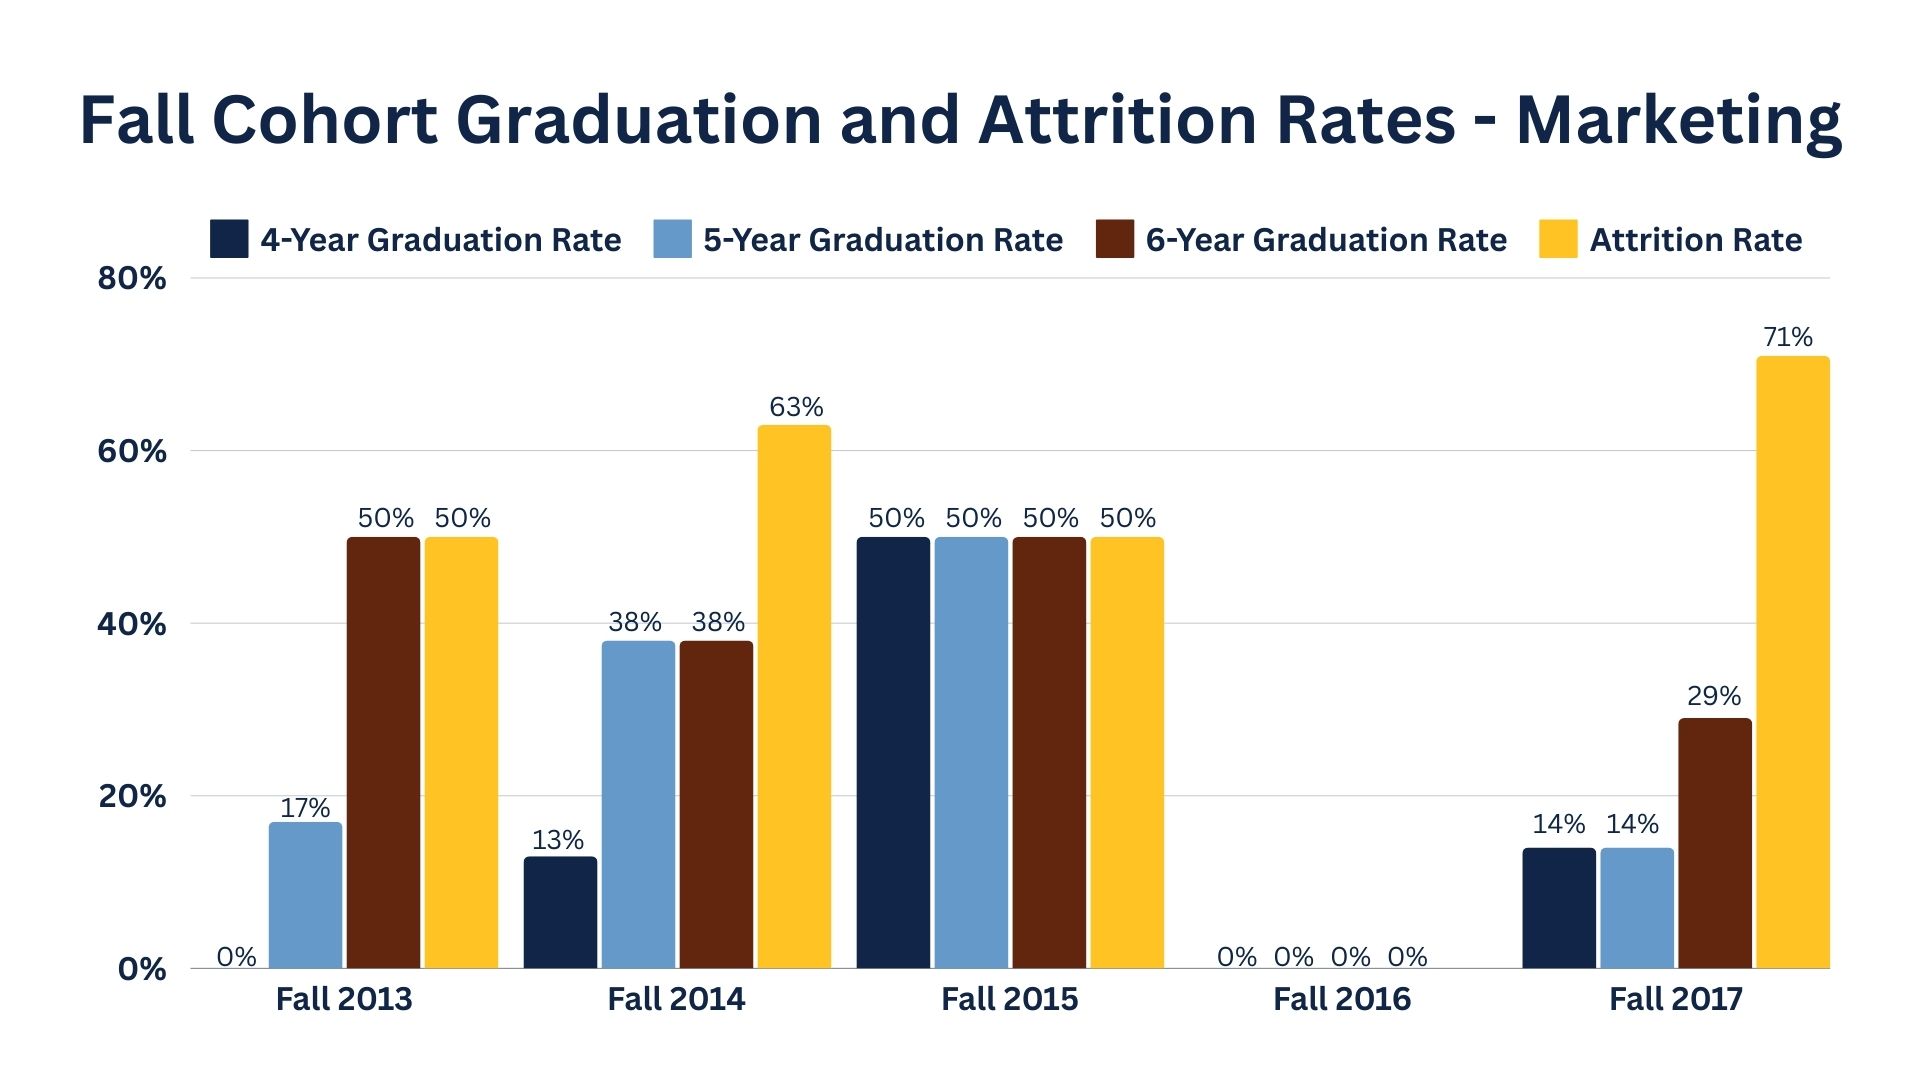
| AY 2019 | AY 2020 | AY 2021 | AY 2022 | AY 2023 | 5-Year Average |
|---|---|---|---|---|---|
| 5 | 10 | 8 | 6 | 6 | 7 |
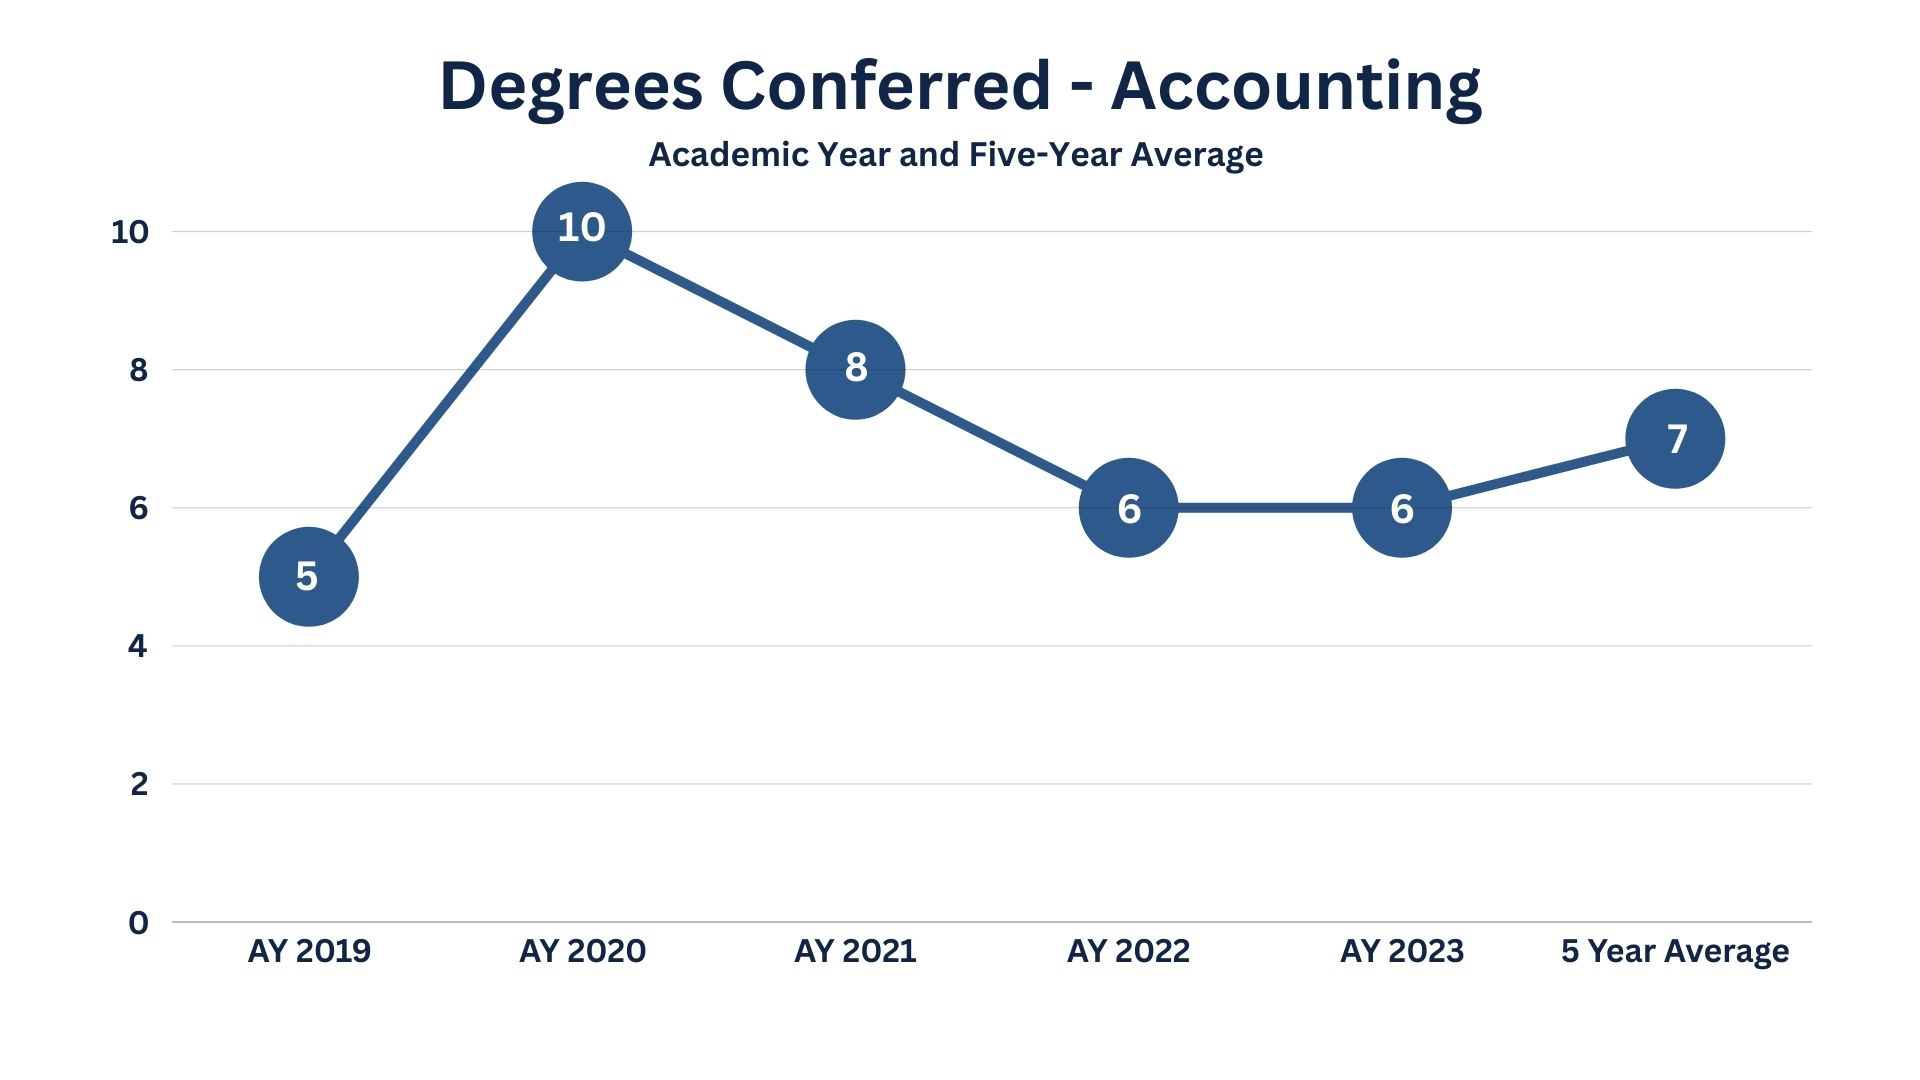
| Academic Year | # of Graduates | # of Respondents | Employed Full-Time | Employed Part-Time | Enrolled in Grad School | Seeking Employment |
|---|---|---|---|---|---|---|
| 2016-2017 | 6 | 4 | 2 | 2 | ||
| 2017-2018 | 5 | 2 | 1 | 1 | ||
| 2018-2019 | 10 | 8 | 7 | 1 | ||
| 2019-2020 | 8* | |||||
| 2020-2021 | 6 | 4 | 3 | 1 | ||
| 2021-2022 | 4 | 1 | 1 | |||
| 2022-2023 | 6 | 2 | 1 | 1 |
Note: Career Outcomes data is collected via the Lincoln University Graduate Employment Outcomes Survey; thus, the data is self-reported.
*Data not collected due to COVID-19.
Students graduating from our Accounting program hold positions such as those listed below:
- Accounting Specialist with the Department of Elementary and Secondary Education
- Accountant at Graves and Associates, CPAs
- Restaurant Accountant at Landry's
- Tax Intern at Williams Keeper, LLC
- Incentive Specialist at the Missouri Department of Economic Development
- Accounts Receivable Specialist at Equipment Share
- Staff Accountant at JCMG
- Universal Banker II at Providence Bank
- Staff Auditor at Central Bank
- Student Accounts Counselor II at Lincoln University
- Accountant 1 at Lincoln University
Business Administration Student Outcome Data
| Semester | Full-Time Students | Part-Time Students | Total Students |
|---|---|---|---|
| Fall 2019 | 178 | 11 | 189 |
| Fall 2020 | 176 | 9 | 185 |
| Fall 2021 | 179 | 24 | 203 |
| Fall 2022 | 141 | 9 | 150 |
| Fall 2023 | 142 | 11 | 153 |
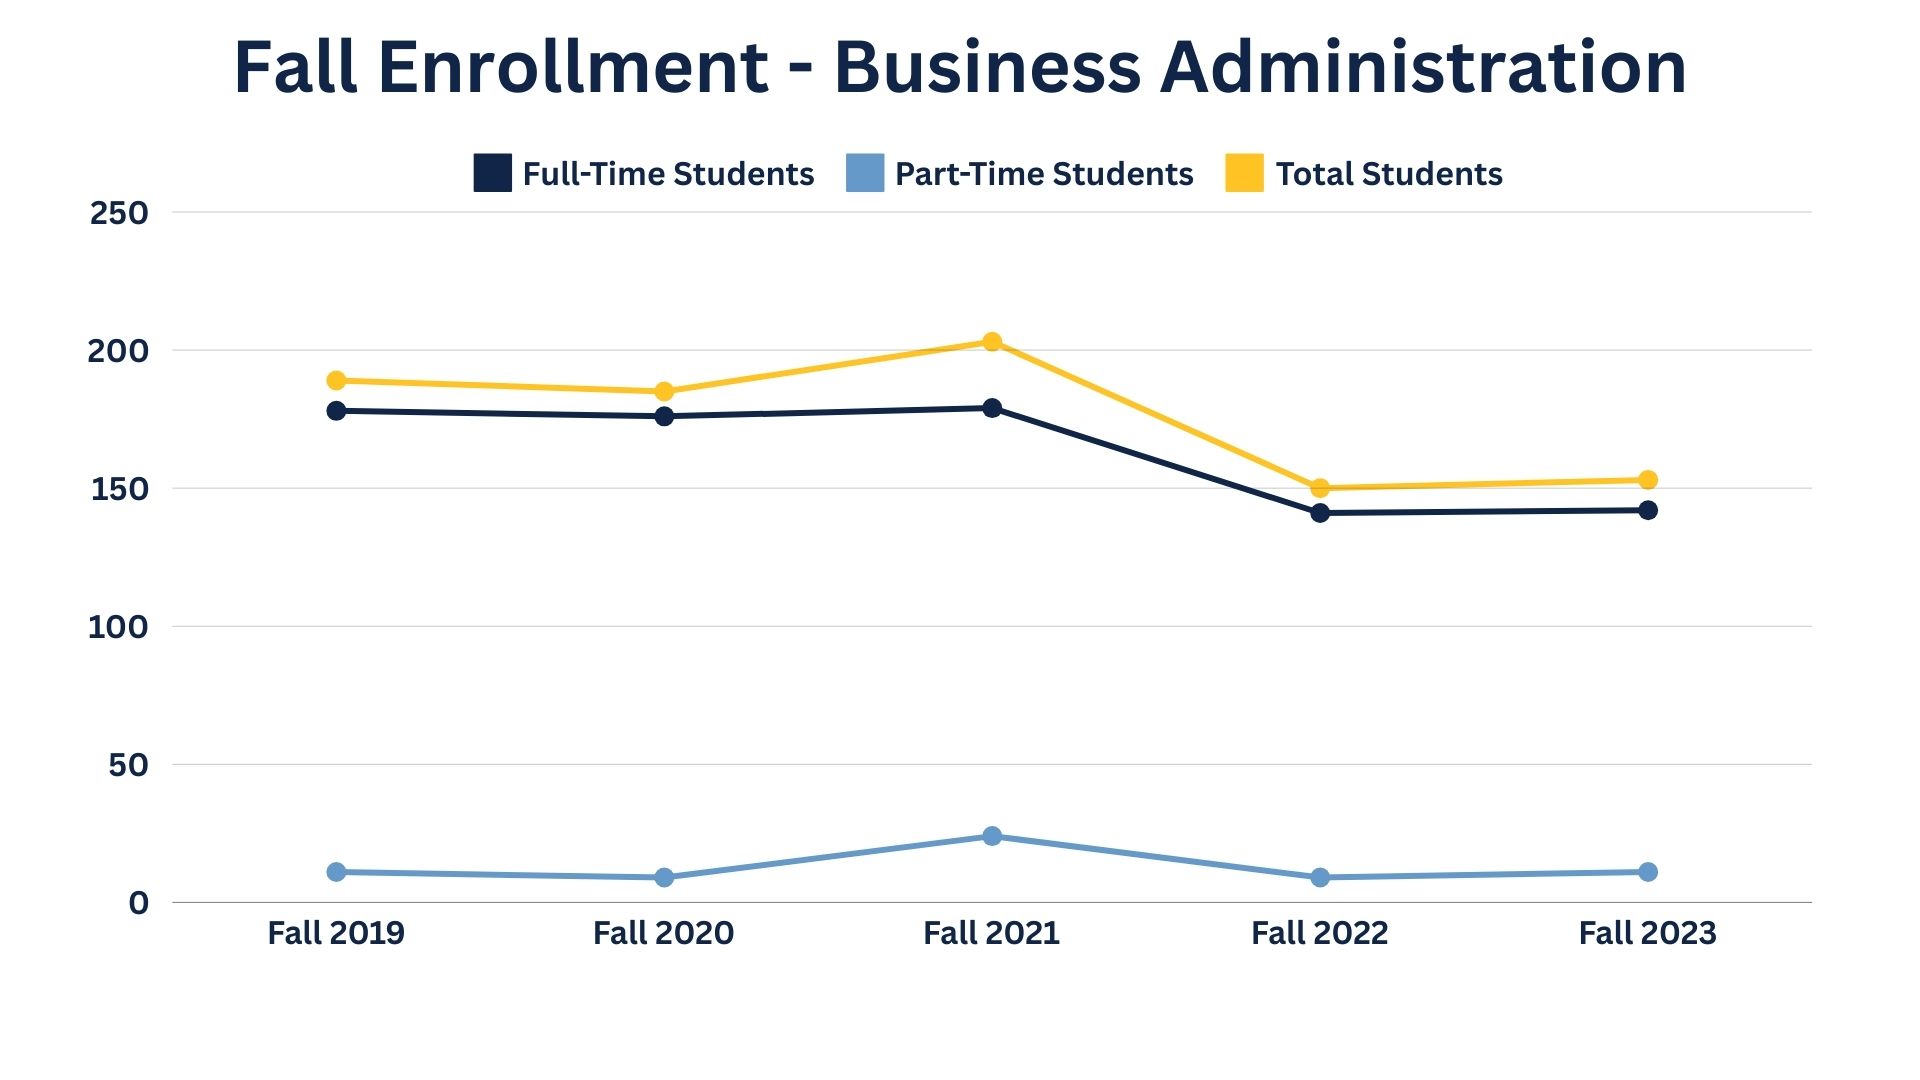
| Cohort | Number in Cohort | Retained in Major | Retained in Major Rate | Retained in Different Major | Different Major Rate |
|---|---|---|---|---|---|
| Fall 2018 | 42 | 16 | 38% | 2 | 5% |
| Fall 2019 | 38 | 17 | 45% | 2 | 5% |
| Fall 2020 | 49 | 19 | 39% | 1 | 2% |
| Fall 2021 | 33 | 13 | 39% | 0 | 0% |
| Fall 2022 | 33 | 12 | 36% | 1 | 3% |
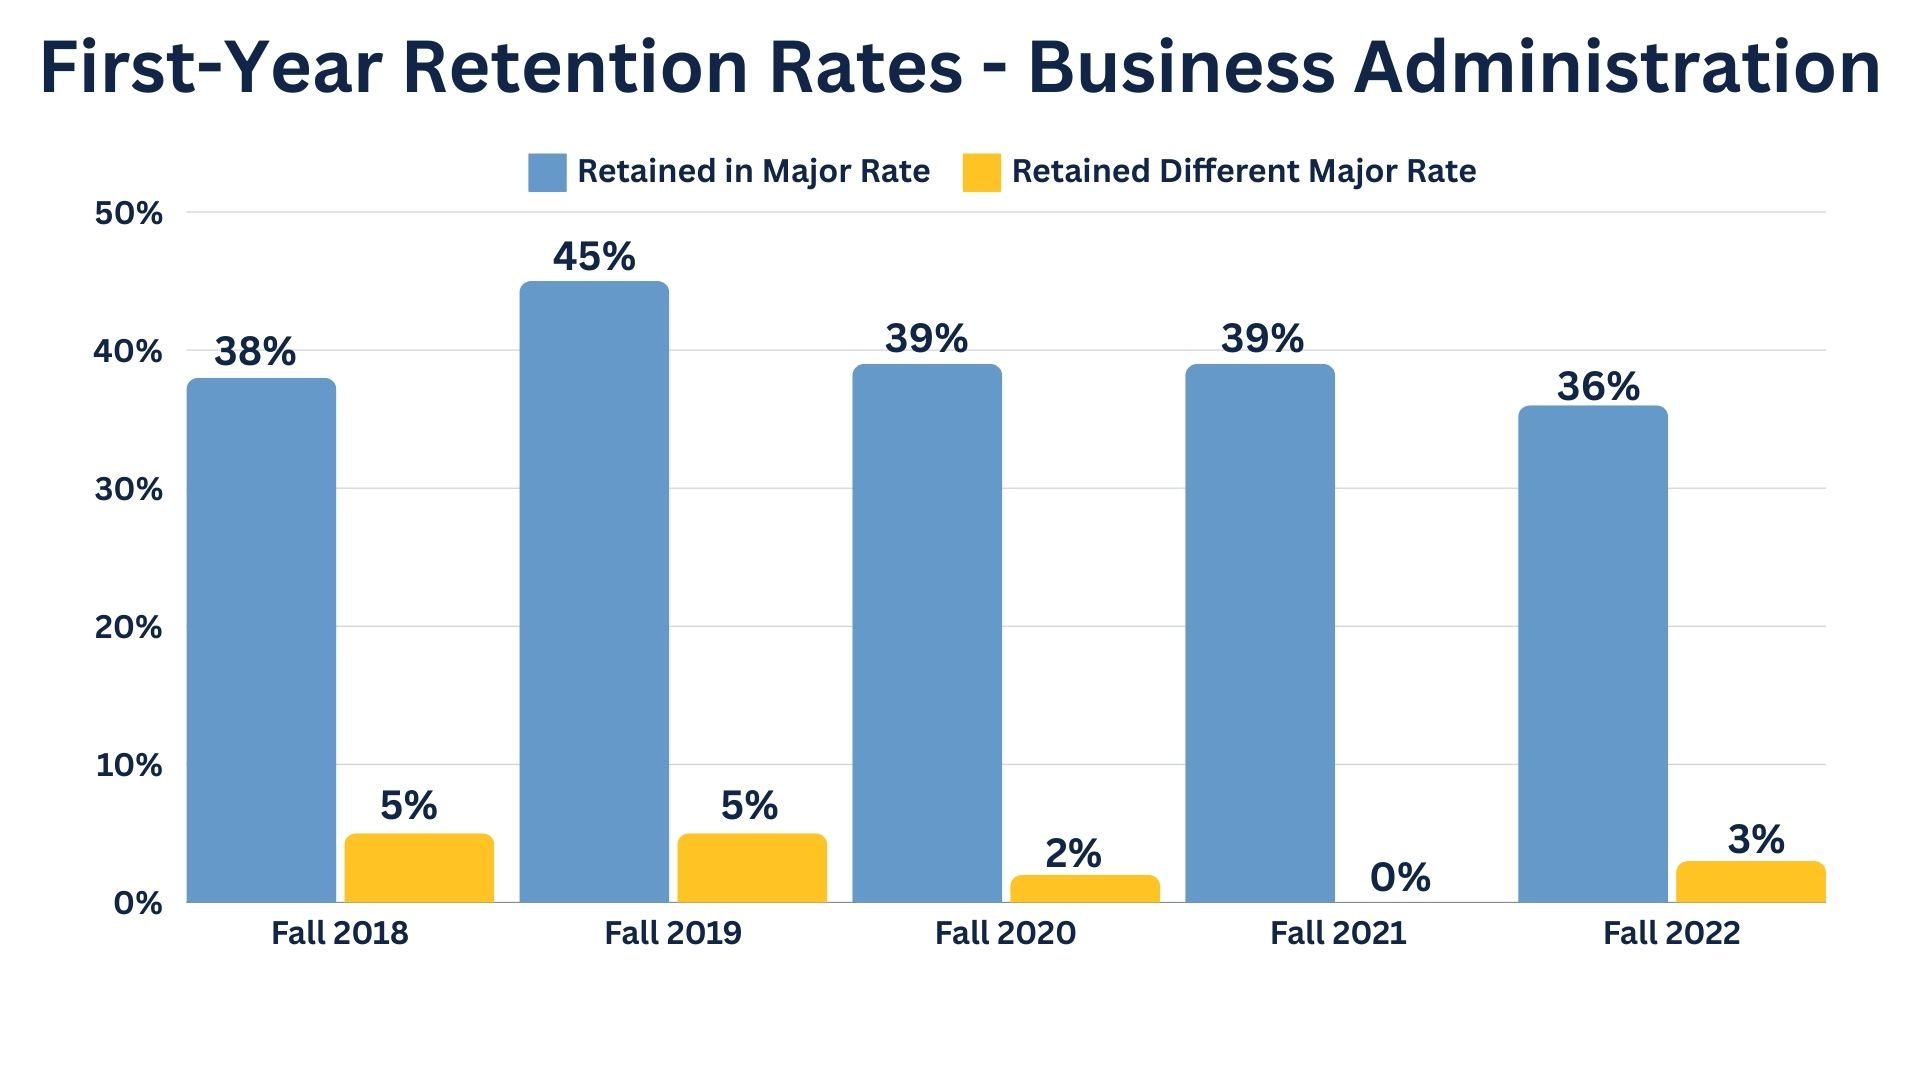
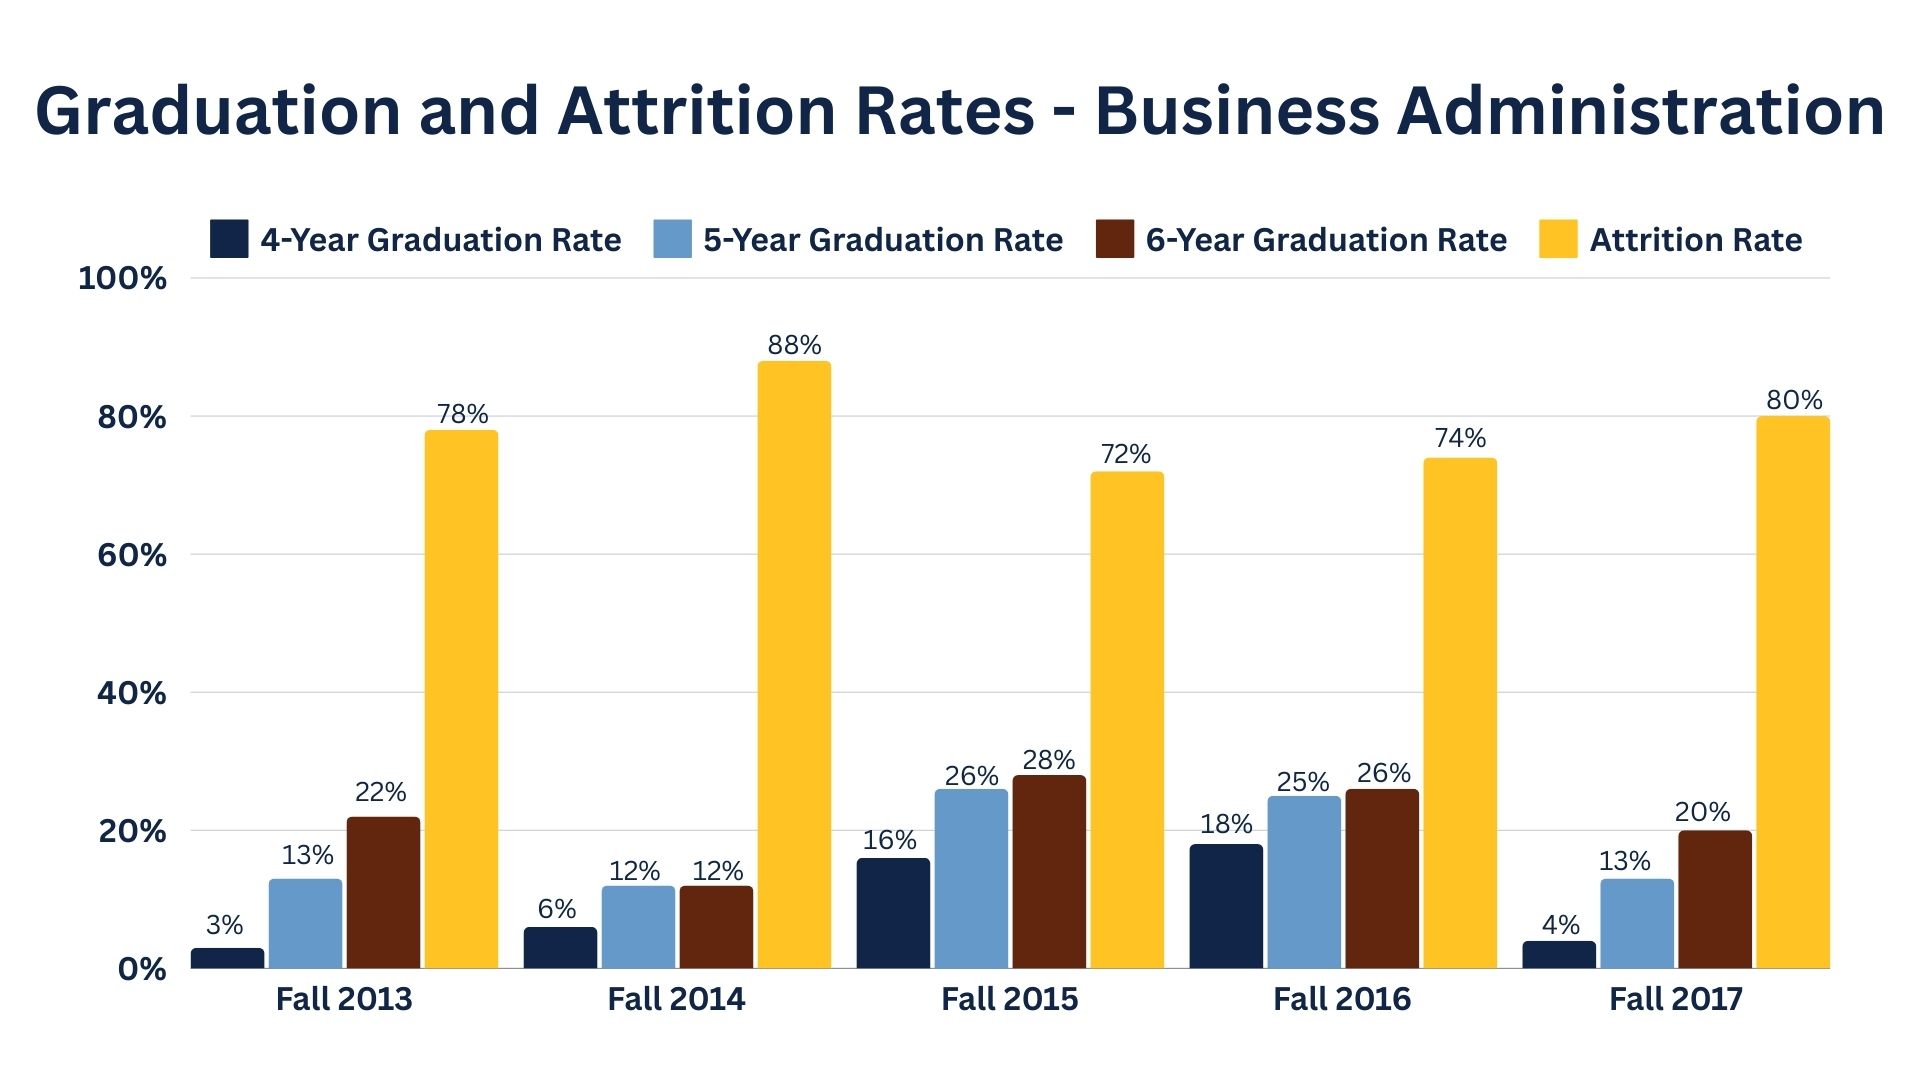
| Cohort | Number in Cohort | Grad in 4 Years | Graduation Rate | Grad in 5 Years | Graduation Rate | Grad in 6 Years | Graduation Rate | Attrition Rate |
|---|---|---|---|---|---|---|---|---|
| Fall 2013 | 32 | 1 | 3% | 4 | 13% | 7 | 22% | 78% |
| Fall 2014 | 51 | 3 | 6% | 6 | 12% | 6 | 12% | 88% |
| Fall 2015 | 58 | 9 | 16% | 15 | 26% | 16 | 28% | 72% |
| Fall 2016 | 61 | 11 | 18% | 15 | 25% | 16 | 26% | 74% |
| Fall 2017 | 56 | 2 | 4% | 7 | 13% | 11 | 20% | 80% |
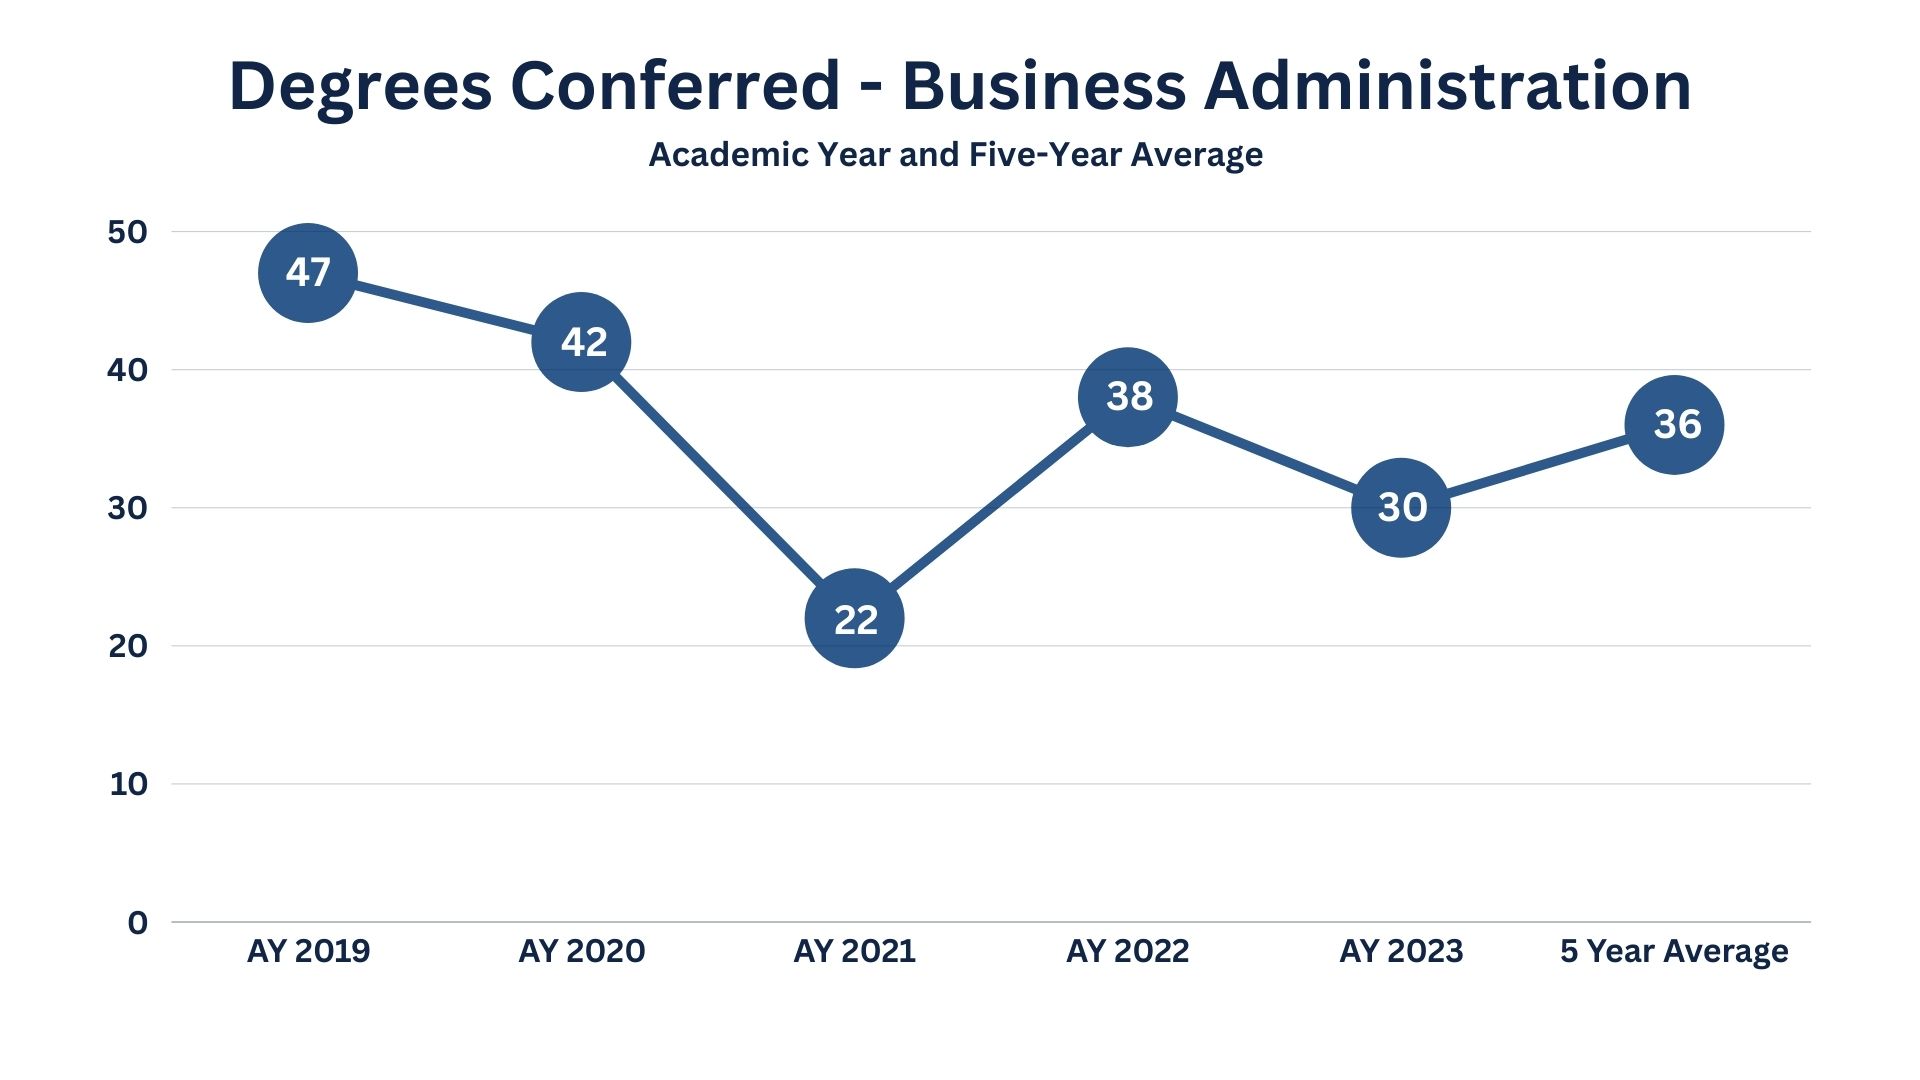
| AY 2019 | AY 2020 | AY 2021 | AY 2022 | AY 2023 | 5-Year Average |
|---|---|---|---|---|---|
| 47 | 42 | 22 | 38 | 30 | 36 |
| Academic Year | # of Graduates | # of Respondents | Employed Full-Time | Employed Part-Time | Enrolled in Grad School | Planning to Enroll in Grad School | Seeking Employment | Seerving in the US Military |
|---|---|---|---|---|---|---|---|---|
| 2016-2017 | 18 | 8 | 4 | 2 | 1 | 1 | ||
| 2017-2018 | 33 | 16 | 12 | 3 | 1 | |||
| 2018-2019 | 47 | 23 | 12 | 3 | 3 | 1 | 3 | 1 |
| 2019-2020 | 42* | |||||||
| 2020-2021 | 22 | 7 | 3 | 1 | 3 | |||
| 2021-2022 | 38 | 8 | 5 | 2 | 1 | |||
| 2022-2023 | 30 | 6 | 4 | 1 | 1 |
Note: Career Outcomes data is collected via the Lincoln University Graduate Employment Outcomes Survey; thus, the data is self-reported.
*Data not collected due to COVID-19.
Students graduating from our Business Administration program hold positions such as those listed below:
- Investment Advisors Coordinator at Central Investment Advisors
- Transaction Coordinator at Veteran's United Home Loans
- Executive Assistant at the Office of the Missouri State Auditor
- Manager at Xerox
- Information Technologies at the Missouri Department of Higher Education
- Operations Manager at Amazon
- Master Designer at JC Penney
- Associate Banker at JP Morgan Chase
- Procurement Analyst
- Medical Data Analyst at Intertel
- Associate Manager at Ralph Lauren
- Logistics Team Analyst at Scholastics
- Real Estate Loan Processor at Maries County Bank
Marketing Student Outcome Data
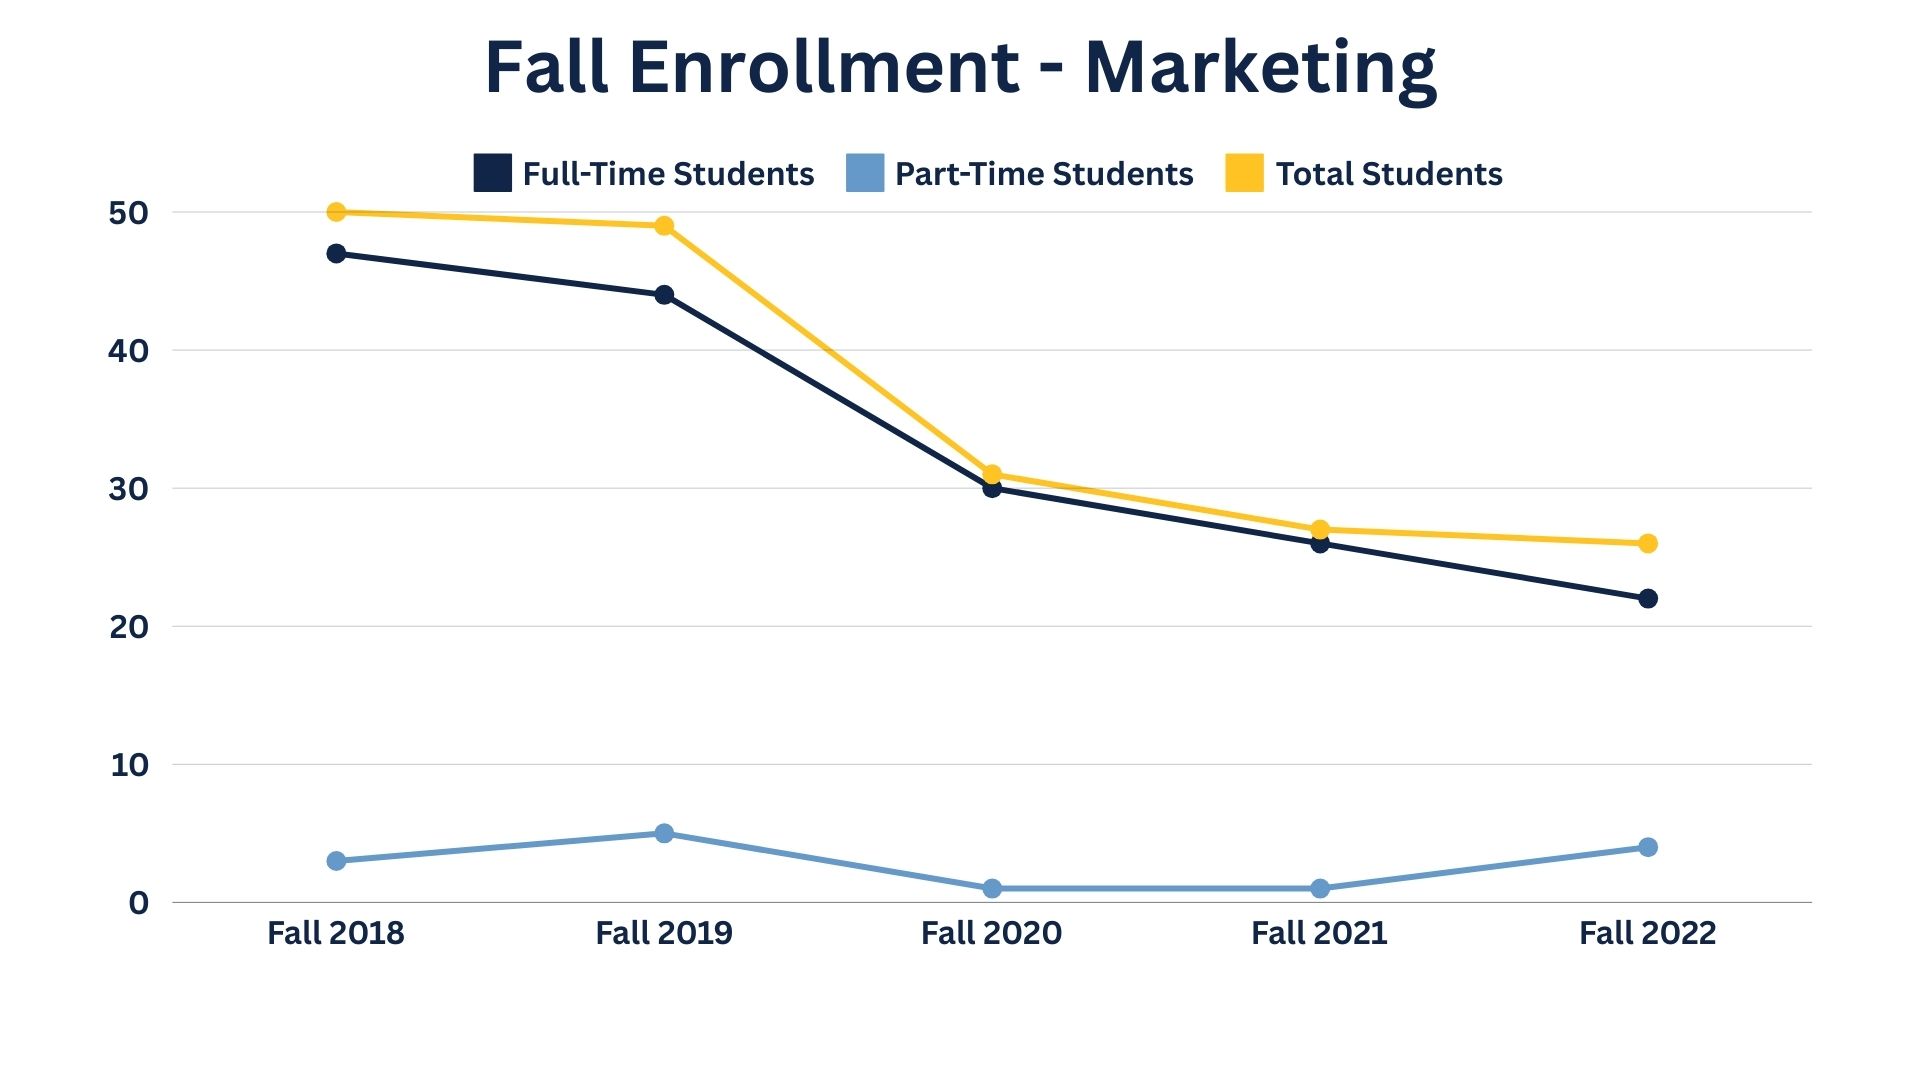
| Semester | Full-Time Students | Part-Time Students | Total Students |
|---|---|---|---|
| Fall 2018 | 47 | 3 | 50 |
| Fall 2019 | 44 | 5 | 49 |
| Fall 2020 | 30 | 1 | 31 |
| Fall 2021 | 26 | 1 | 27 |
| Fall 2022 | 22 | 4 | 26 |
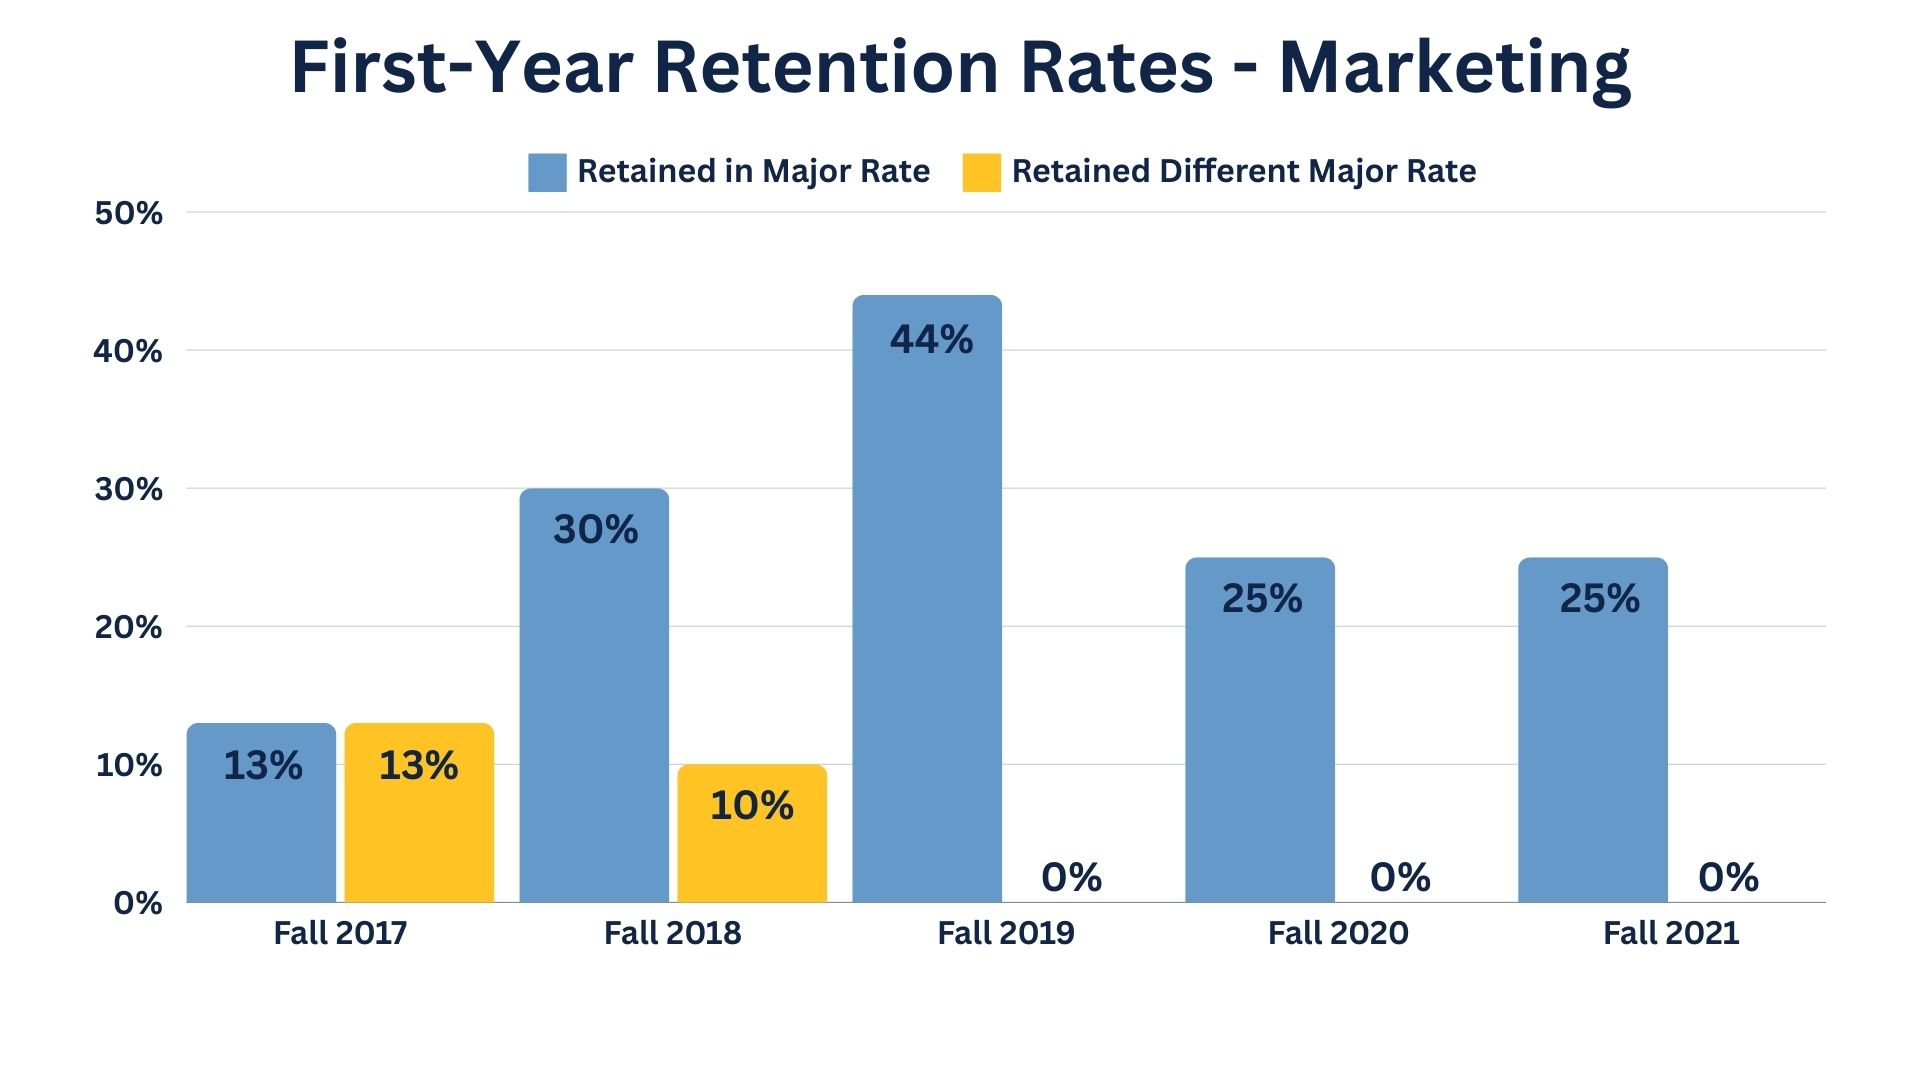
| Cohort | Number in Cohort | Retained in Major | Retained in Major Rate | Retained in Different Major | Different Major Rate |
|---|---|---|---|---|---|
| Fall 2017 | 8 | 1 | 13% | 1 | 13% |
| Fall 2018 | 10 | 3 | 30% | 1 | 10% |
| Fall 2019 | 9 | 4 | 44% | 0 | 0% |
| Fall 2020 | 4 | 1 | 25% | 0 | 0% |
| Fall 2021 | 4 | 1 | 25% | 0 | 0% |
|
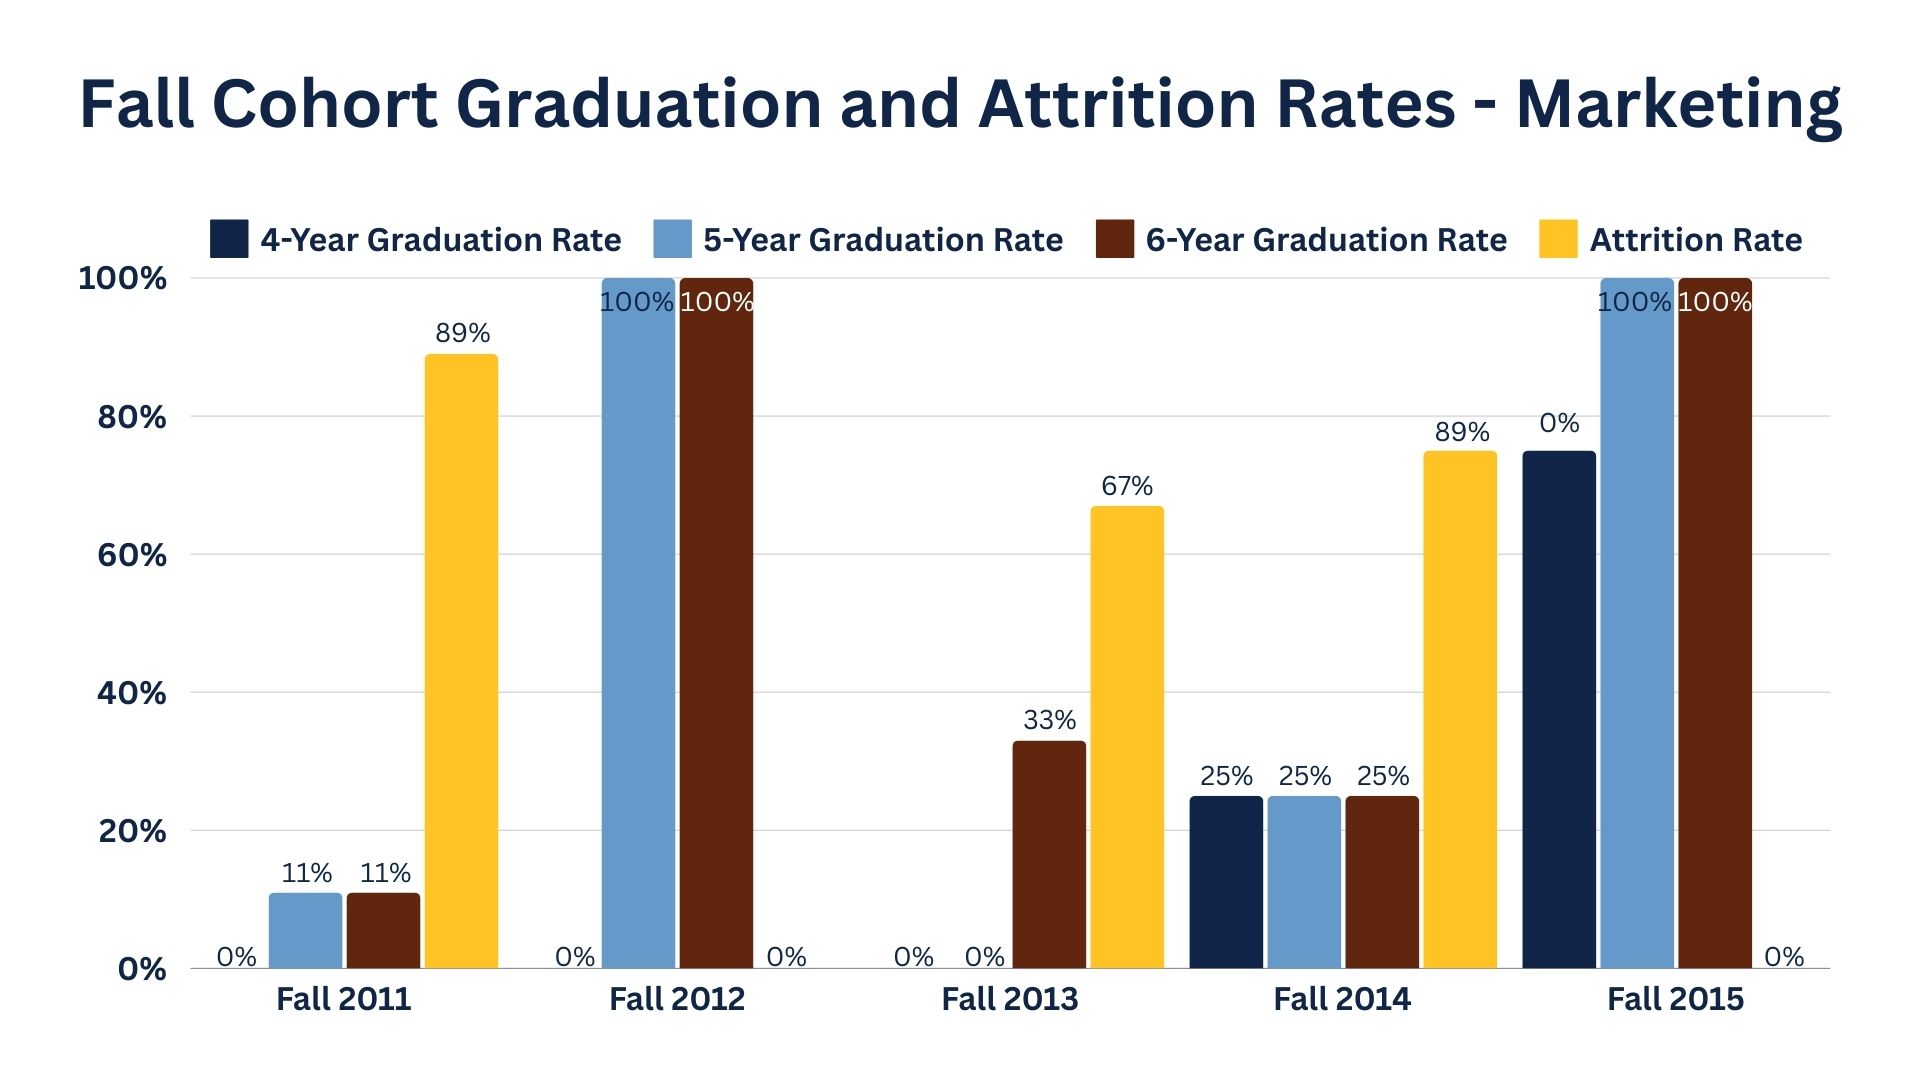
Cohort
|
Number in Cohort
|
Grad in 4 Years
|
Graduation Rate
|
Grad in 5 Years
|
Graduation Rate
|
Grad in 6 Years
|
Graduation Rate
|
Attrition Rate
|
|---|---|---|---|---|---|---|---|---|
|
Fall 2011
|
9
|
0
|
0%
|
1
|
11%
|
1
|
11%
|
89%
|
|
Fall 2012
|
1
|
0
|
0%
|
1
|
100%
|
1
|
100%
|
0%
|
|
Fall 2013
|
6
|
0
|
0%
|
0
|
0%
|
2
|
33%
|
67%
|
|
Fall 2014
|
8
|
2
|
25%
|
2
|
25%
|
2
|
25%
|
75%
|
|
Fall 2015
|
4
|
3
|
75%
|
4
|
100%
|
4
|
100%
|
0%
|
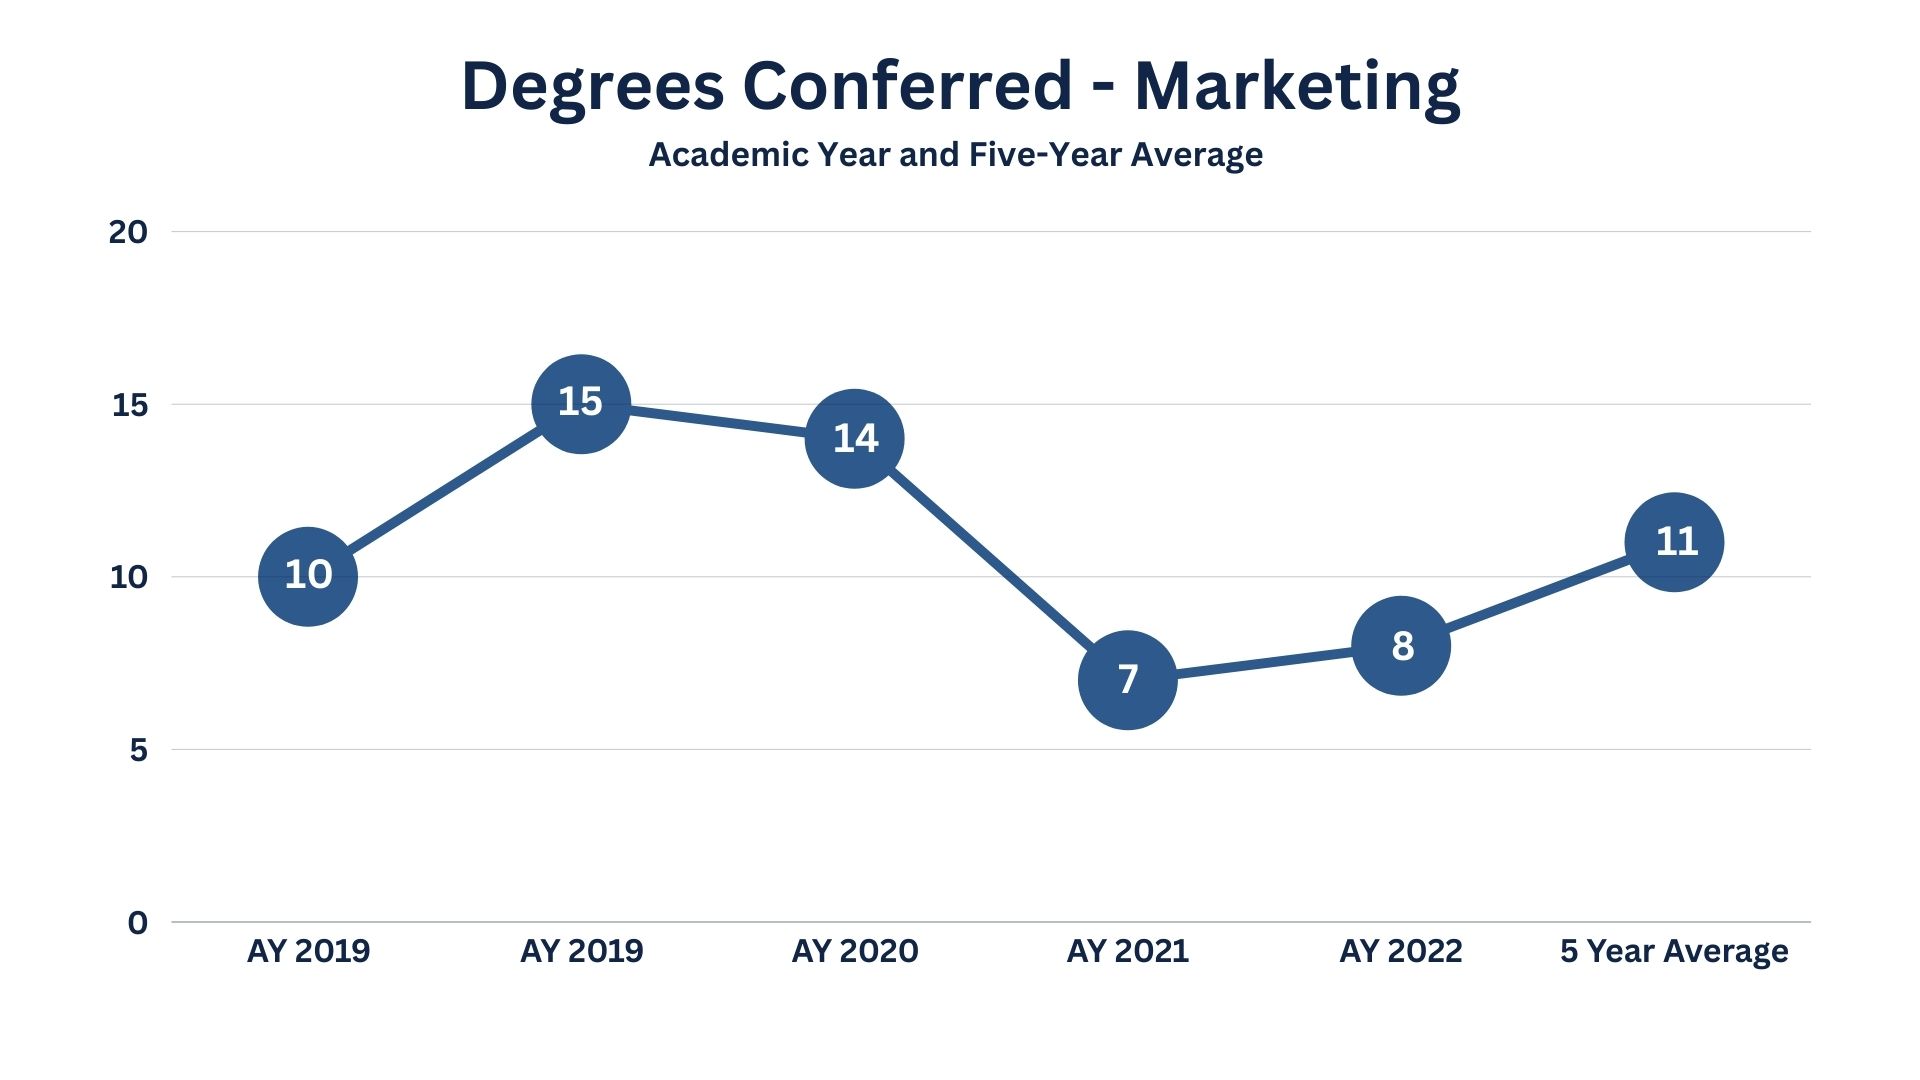
| AY 2018 | AY 2019 | AY 2020 | AY 2021 | AY 2022 | 5-Year Average |
|---|---|---|---|---|---|
| 10 | 15 | 14 | 7 | 8 | 11 |
| Academic Year | # of Graduates | # of Respondents | Employed Full-Time | Employed Part-Time | Enrolled in Grad School | Planning to Enroll in Grad School | Seeking Employment | Seerving in the US Military |
|---|---|---|---|---|---|---|---|---|
| 2016-2017 | 4 | 3 | 1 | 1 | ||||
| 2017-2018 | 10 | 8 | 7 | 1 | ||||
| 2018-2019 | 15 | 7 | 3 | 1 | 1 | 1 | 1 | |
| 2019-2020 | 14* | |||||||
| 2020-2021 | 7 | 4 | 2 | 1 | 1 |
Note: Career Outcomes data is collected via the Lincoln University Graduate Employment Outcomes Survey; thus, the data is self-reported.
*Data not collected due to COVID-19.
Students graduating from our Marketing program hold positions such as those listed below:
- Management Trainee at Sherwin-Williams
- Sales Coordinator at Double Tree Hilton
- Sales Event Manager at Missouri Lottery
- Territory Sales Manager at Altria
- Self Employed Tattoo Artist
- Communication Specialist at Lincoln University
- Sales and Leasing Professional at Capital City Ford
- Portfolio Administrator Coordinator at Cushman and Wakefield
MBA Student Outcome Data
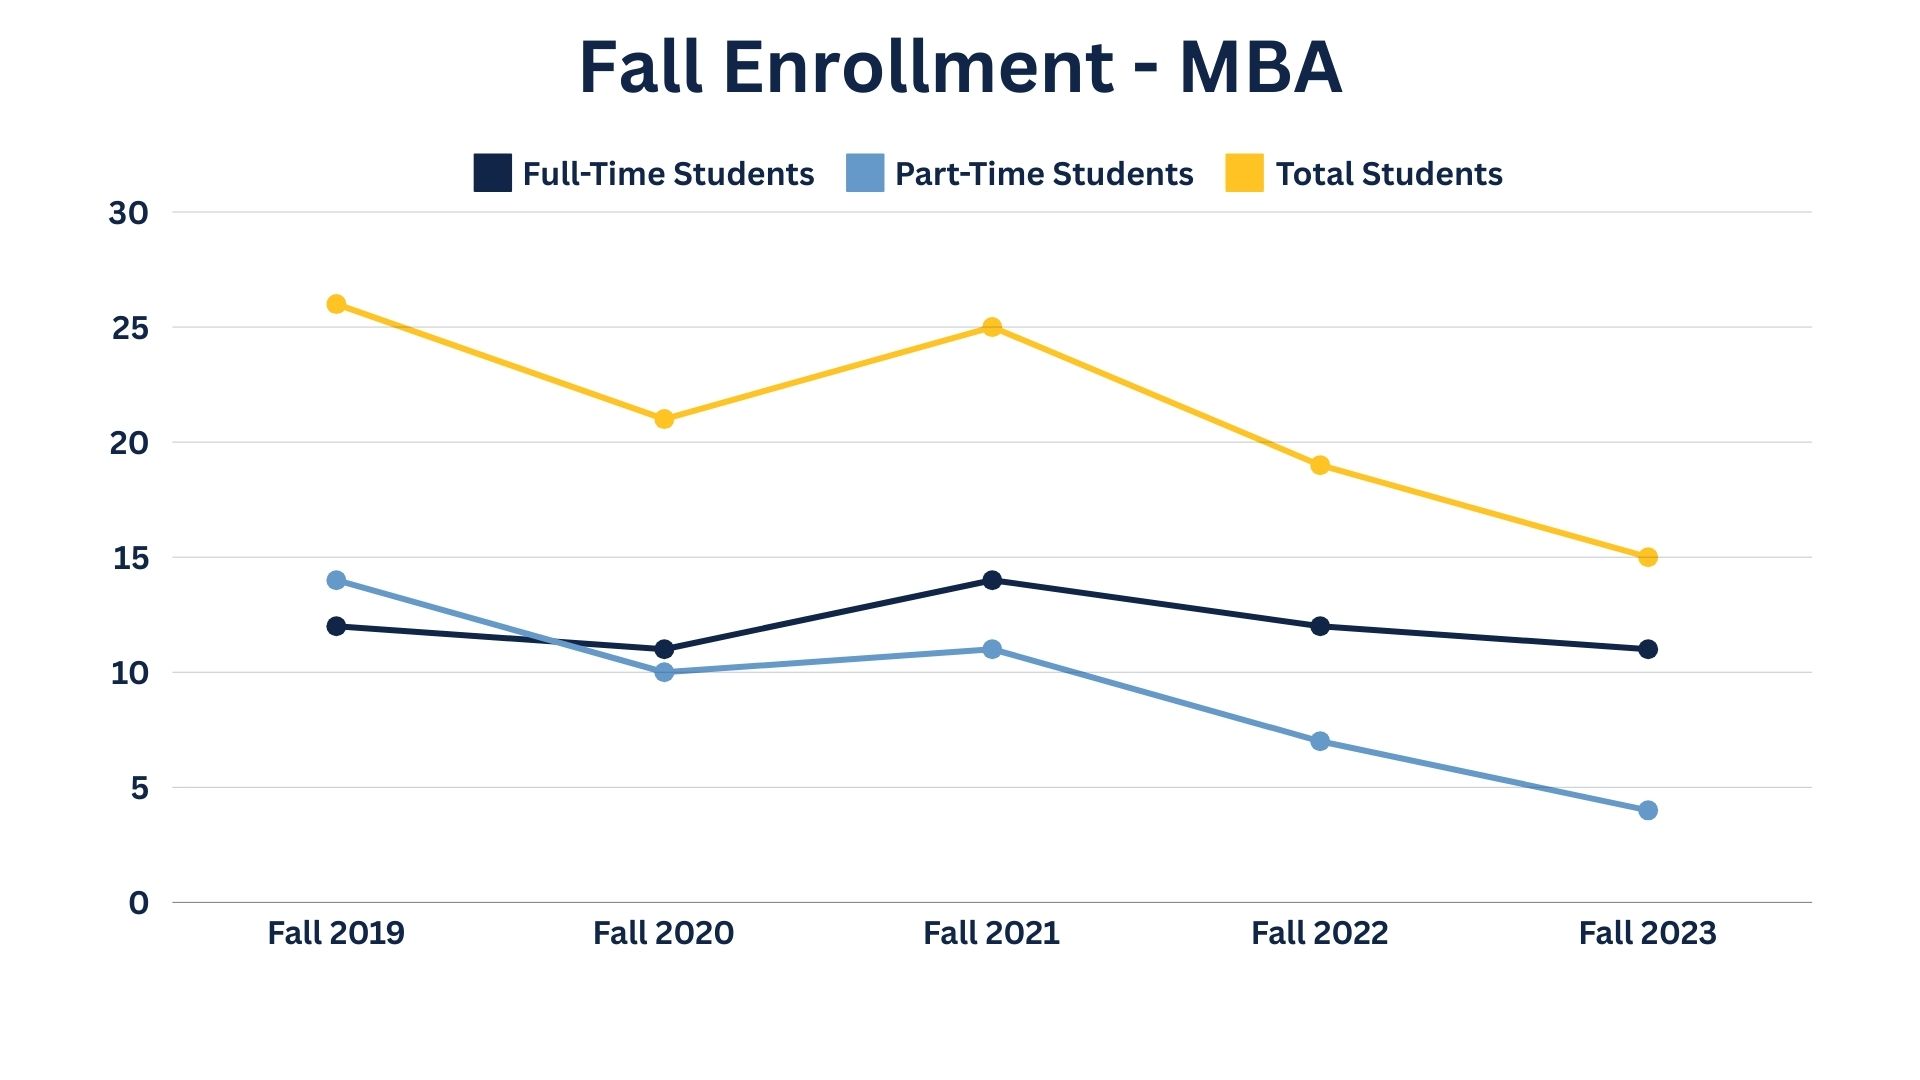
| Semester | Full-Time Students | Part-Time Students | Total Students |
|---|---|---|---|
| Fall 2019 | 12 | 14 | 26 |
| Fall 2020 | 11 | 10 | 21 |
| Fall 2021 | 14 | 11 | 25 |
| Fall 2022 | 12 | 7 | 19 |
| Fall 2023 | 11 | 4 | 15 |
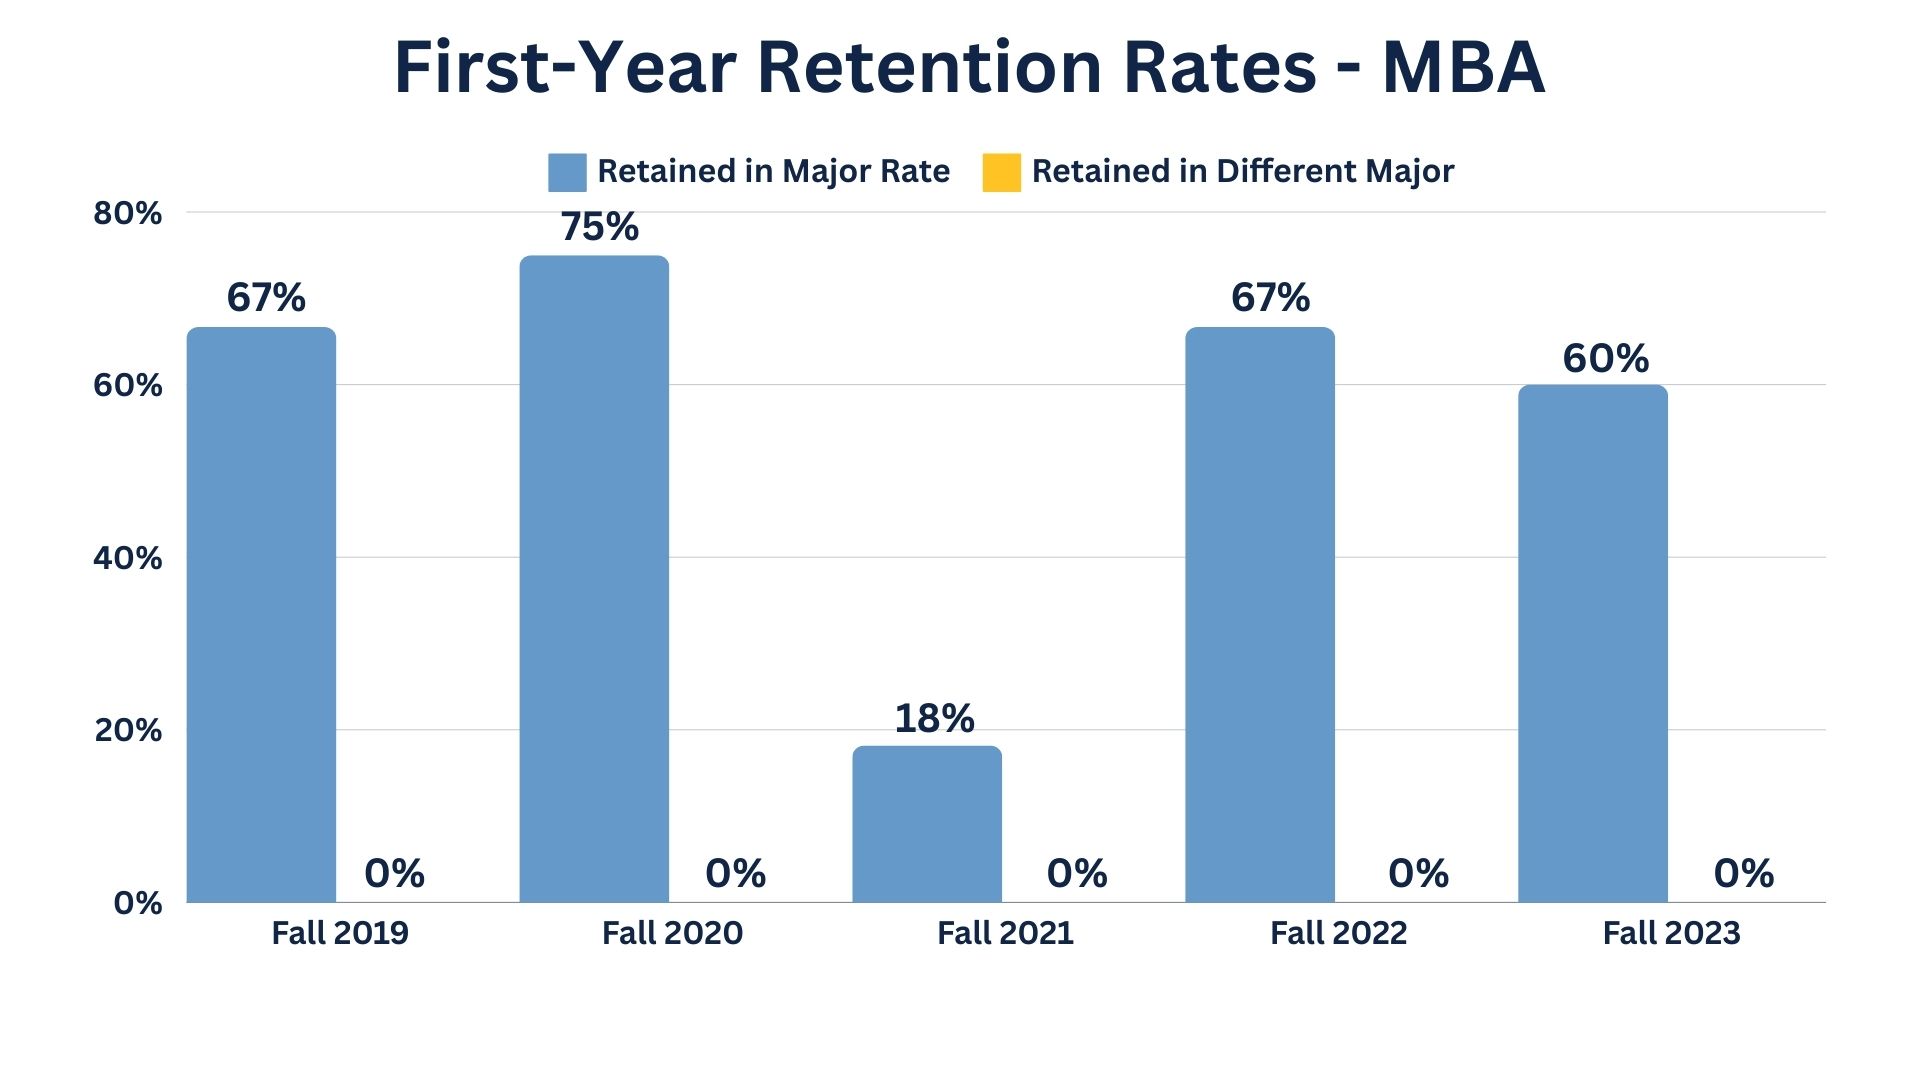
| Cohort | Number in Cohort | Retained in Major | Retained in Major Rate | Retained in Different Major | Different Major Rate |
|---|---|---|---|---|---|
| Fall 2018 | 8 | 5 | 63% | 0 | 0% |
| Fall 2019 | 12 | 8 | 67% | 0 | 0% |
| Fall 2020 | 4 | 3 | 75% | 0 | 0% |
| Fall 2021 | 11 | 2 | 18% | 0 | 0% |
| Fall 2022 | 6 | 4 | 67% | 0 | 0% |
| Fall 2023 | 5 | 3 | 60% | 0 | 0% |
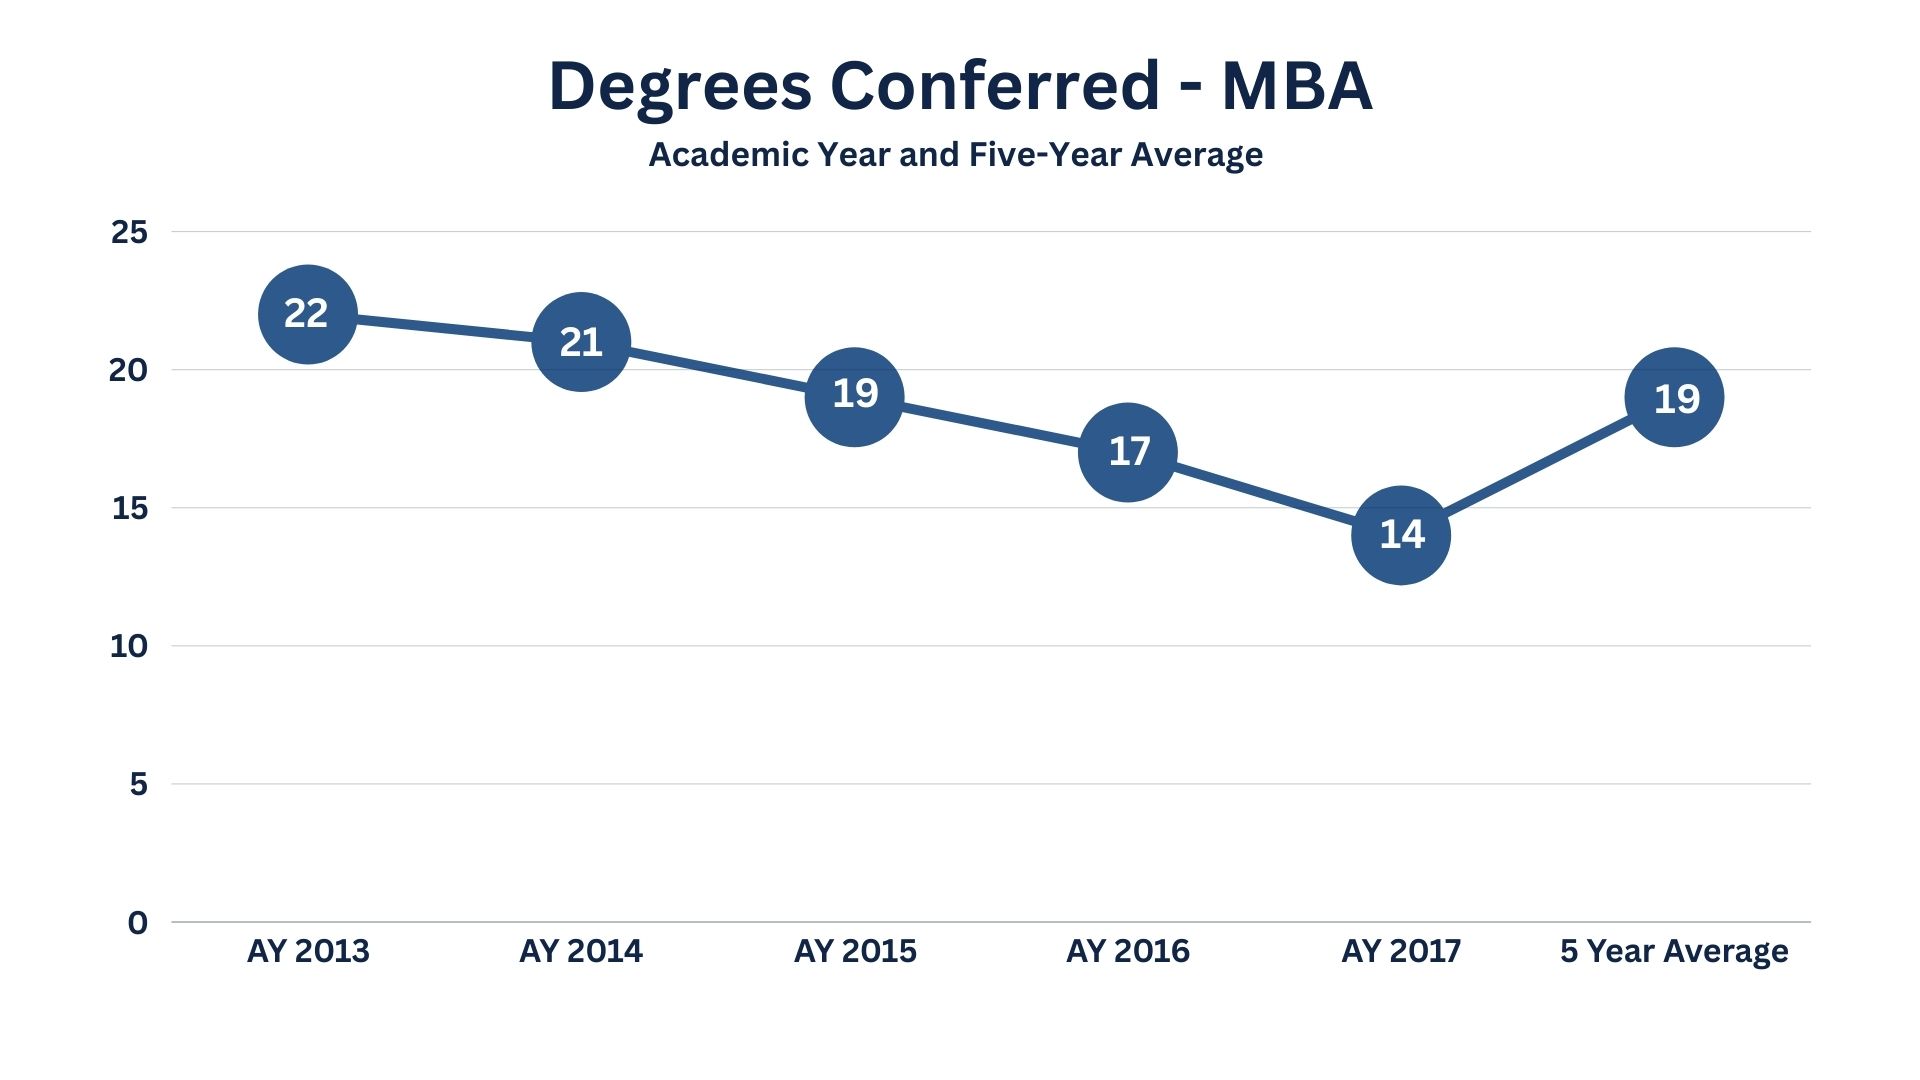
| AY 2013 | AY 2014 | AY 2015 | AY 2016 | AY 2017 | 5-Year Average |
|---|---|---|---|---|---|
| 22 | 21 | 19 | 17 | 14 | 19 |
